The Mosaic Q Project
The goal of this project is to draw attention to a structural trait apparently present in all proteins.
We believe the sooner this property is appreciated the better, as it may help to increase understanding of protein functioning and enhance more efective design of therapeutics.
For extensive documentation, see the project at GitHub.
Introduction
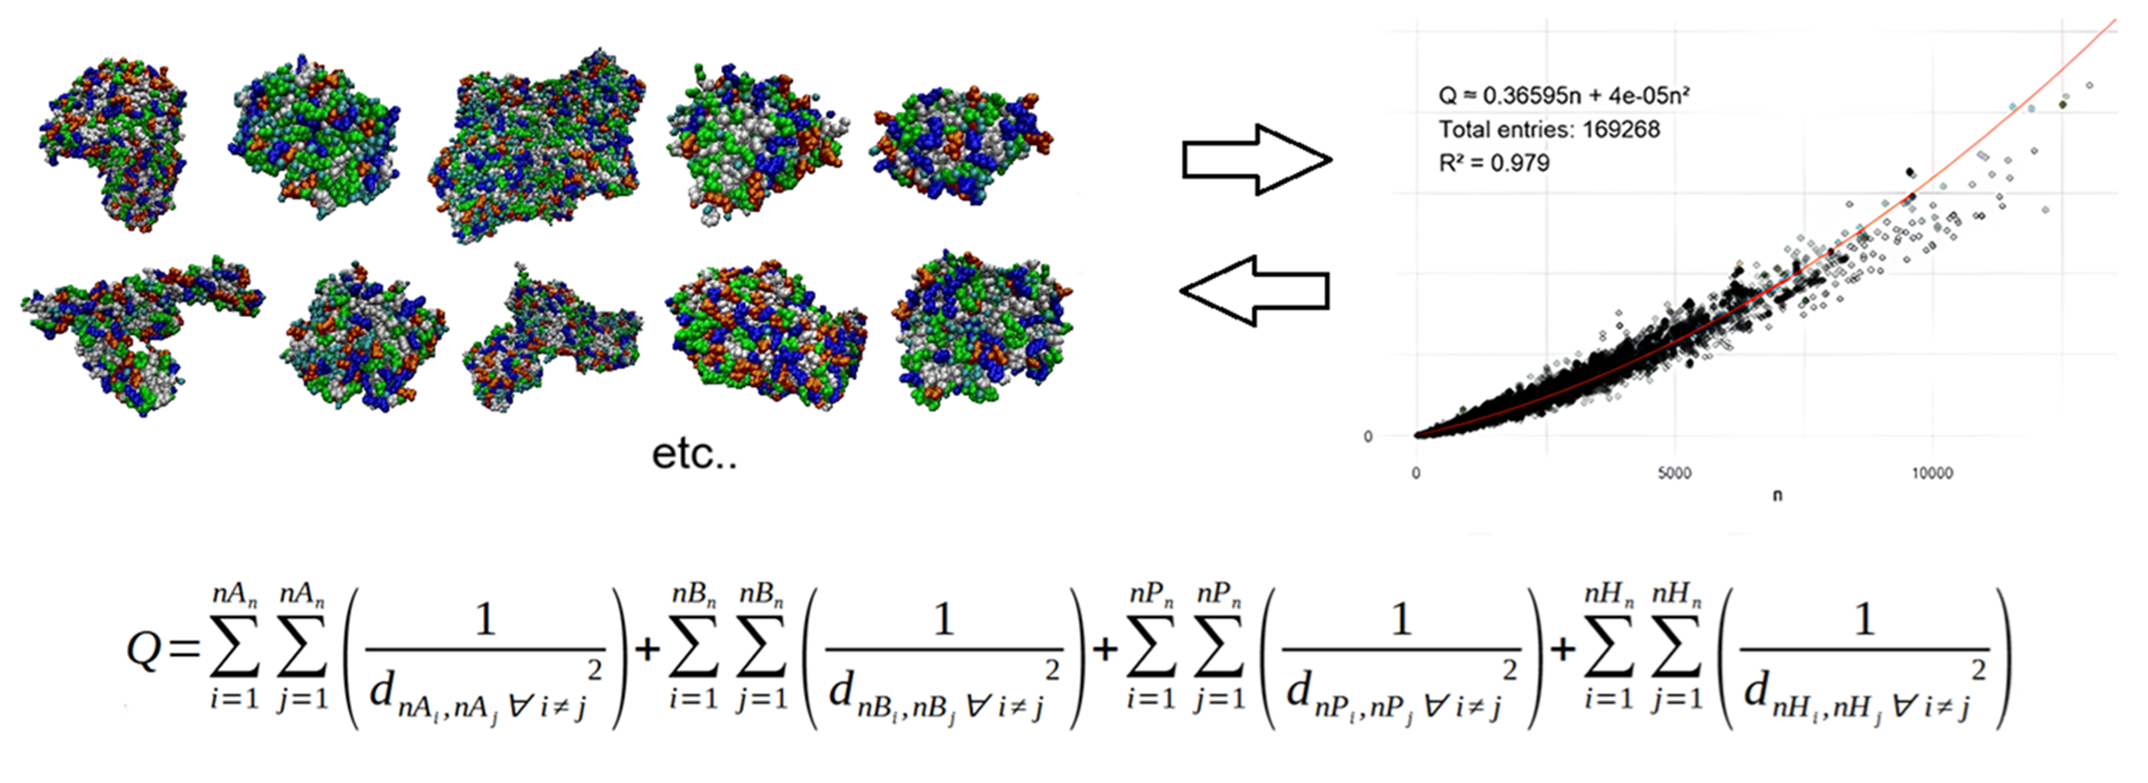
Big data analysis of the 3D structure of proteins reveals amino acids group into four distinct types: polar, hydrophobic, acidic, basic. Surprisingly, these clusters of amino acids are very similar in apparently all proteins, giving rise to a characteristic mosaic present in all of them. This pattern can be quantified by the parameter Q, which is also shown to depend very precisely (R2=0.978) on the number of residues. The presence of the equation in the >160,000 proteins analyzed is interpreted as a direct consequence of the presence of the mosaic in the vast majority of proteins.
(See figure above)
The calculation of Q involves the measurement of distances between amino acids of the same type.
What is the mosaic like?
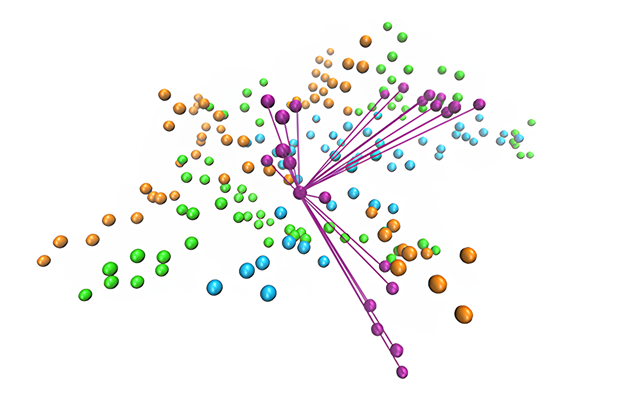
In order to understand the mosaic, a series of novel stochastic simulations were performed (see details in GitHub). It is demonstrated that the shape of the empirical equation for Q is achieved with a specific mosaic configuration, where amino acids are clustered together in groups of 8 amino acids in average, where all them are at a maximum distance of 3.8 Å from at least another one in the same cluster.
The mosaic model is compatible with the well-known existence of the hydrophobic/hydrophilic core in proteins. What is stated here is that, aside from the core, amino acids also apparently group together in clusters according to their chemical type (polar, hydrophobic, acidic, basic) in groups of approximately 8 amino acids following specific a shape.
Importantly, the Mosaic Q configuration seems to be confirmed also visually by multiple examples of proteins (see the repository).

Conclusions
Hence, a)big data analysis, b)stochastic simulations and c)real example images of proteins demonstrate the existence of the Mosaic Q.
All the details and source code are available in GitHub, also, a preprint is available here.
Note: For the depiction of the 3D protein structures, the software VMD was employed. See: Humphrey W, et al. VMD - Visual Molecular Dynamics. J Mol Graph. 1996;14:33-8. https://doi.org/10.1016/0263-7855(96)00018-5.
Collaboration
As you've probably guessed, the more protein image examples in the repository the greater the evidence of the Mosaic Q.
Also, the more people who are aware and support the project the stronger the evidence is. Accordingly, you can become a contributor of the project by joining (it's totally free) and providing your own Mosaic Q image example to the repository .